Разработка • dev.to • 13 мая 2024 г. 16:16
Marketing combines creativity with data-driven tactics, where effective data reporting is pivotal to the success of an ad or campaign. By providing actionable insights, reporting empowers marketers to make informed decisions, craft impactful campaign...... читать далее
datavisualization boldreports datareporting marketinginsightsРазработка • dev.to • 30 апреля 2024 г. 17:59
In the world of lending the looming challenge of loan defaults presents both risks and opportunities, for banks and financial institutions. Being able to predict these defaults and understand the boundaries for credit extension can make a significant...... читать далее
loanprediction eventdriven python datavisualizationРазработка • dev.to • 20 апреля 2024 г. 19:51
Esta publicações faz parte de documentar do projeto de python em análise de dados organizado com o açai com dados, com o apoio da devs norte que está se fazendo sobre análise de dados com Python e para ficar melhor organizado decidiu documentar as an...... читать далее
análisededados datavisualizationРазработка • dev.to • 19 апреля 2024 г. 8:00
Question title How to display the serial number of each row in a table. Problem Description Through configuration, add a column before the first column of the table to display the row number of each row. Solution rowSeriesNu...... читать далее
javascript datavisualization visactor vtableРазработка • dev.to • 15 апреля 2024 г. 4:30
🐙 GitHub | 🎮 Demo Building a Comprehensive Report for a Time-Tracking Application Using React, TypeScript, and CSS In this article, we'll construct a stunning report featuring filters, a table, a pie chart, and a line chart for an exi...... читать далее
react typescript datavisualization timetrackingDevOps • OpenNET • 7 апреля 2024 г. 23:44
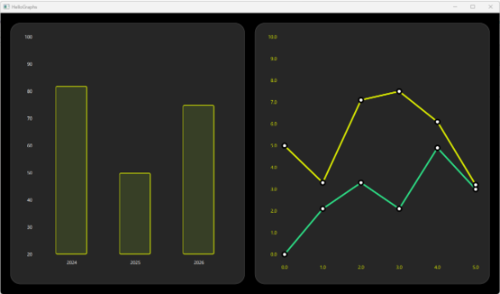
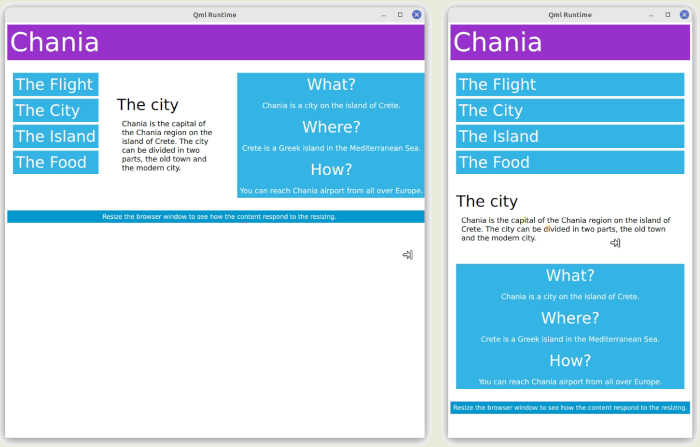
Компания Qt Company опубликовала релиз фреймворка Qt 6.7, в котором продолжена работа по стабилизации и наращиванию функциональности ветки Qt 6. В Qt 6.7 обеспечена поддержка платформ Windows 10+, macOS 12+, Linux (Ubuntu 22.04, openSUSE 15.5, SUSE 1...... читать далее
Разработка • dev.to • 12 марта 2024 г. 15:26
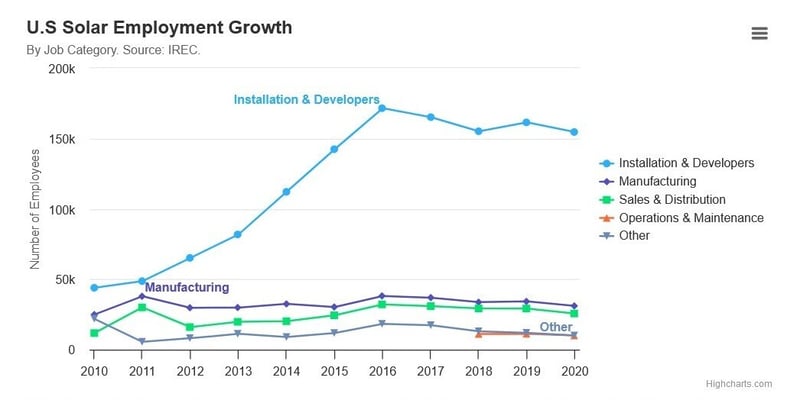
Introduction In my last post, I showed how to use ChartsJS to render data from an ASP.NET application. I also mentioned Highcharts as another possible option. In this post, I will use Highcharts to display the same data as in my previous post: a b...... читать далее
highcharts datavisualization aspdotnet javascriptРазработка • dev.to • 30 ноября 2023 г. 14:42
Here's my article comparing the 8 best BI tools tailored specifically for small businesses. 📊 Why are these tools great for small businesses? No coding or SQL knowledge required Easy setup and no IT knowledge necessary User-friendly e...... читать далее
businessintelligence datavisualization datanalytics businessDevOps • OpenNET • 12 октября 2023 г. 10:18
Компания Qt Company опубликовала релиз фреймворка Qt 6.6, в котором продолжена работа по стабилизации и наращиванию функциональности ветки Qt 6. В Qt 6.6 обеспечена поддержка платформ Windows 10+, macOS 11+, Linux (Ubuntu 22.04, openSUSE 15.4, SUSE 1...... читать далее
Разработка • dev.to • 11 октября 2023 г. 15:24
INTRODUCTION. Just like everything in this world, data has its imperfections. Raw data is usually skewed, may have outliers, or too many missing values. A model built on such data results in sub-optimal performance. In a hurry to get to the machine...... читать далее
beginners datavisualization newbie reactРазработка • dev.to • 29 августа 2023 г. 9:29
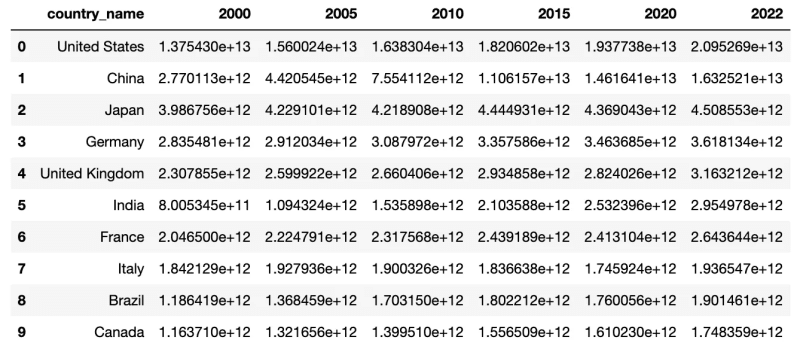
Hi, and welcome to this tutorial, where I’ll teach you to create a country ranking chart using Python and Matplotlib. What I like about this visualization is its clean and beautiful way of showing how countries rank compared to each other on a parti...... читать далее
python datascience tutorial datavisualizationРазработка • dev.to • 14 июня 2023 г. 16:45
Line Plot: A line plot shows the relationship between two variables by connecting data points with straight lines. It is useful for displaying trends or changes over time. For example, you can use a line plot to visualize the stock prices of a compan...... читать далее
python datavisualizationsРазработка • dev.to • 13 марта 2023 г. 8:32
The Web Report Designer is a central element if you’re using List & Label in web applications. We’re constantly improving and adding to it, and with the release of version 28, we’ve added many new objects and functions again. Here’s a quick overv...... читать далее
webdev news datavisualization reportdesignРазработка • dev.to • 26 февраля 2023 г. 6:15
In early 2022 I debuted a talk called "Visualizing Code" that used data visualization to explore patterns in open source projects. This article is the first in a new series that walks you through how to discover and analyze patterns found in your own...... читать далее
python git data datavisualizationРазработка • dev.to • 14 декабря 2021 г. 9:13
As web apps are more suited for real-time data processing, we need more and more data visualization solutions for real-time data, with a responsive layout. In this article, I show you how to make this simple leaderboard, using D3.js and React. D3.j...... читать далее
react javascript d3js datavisualizationРазработка • dev.to • 16 июля 2021 г. 22:37
As Brexit trade negotiations were dragging on at the start of the year, a lot of the discourse was focused on perceived inequities in fishing rights. I felt there was a story in the data that needed to be told. Despite having the largest Exclusive Ec...... читать далее
datascience javascript analytics datavisualizationРазработка • dev.to • 24 июня 2021 г. 16:35
Certification Course helps a person to grandstand his capability, responsibility for the calling, construct aptitude in his expert branch of knowledge, and assists with work progression. It's anything but an assignment procured by an individual givin...... читать далее
webdev python machinelearning programmingРазработка • dev.to • 21 мая 2021 г. 13:58
D3 is a lot more than just a graphing library, it's a toolset for efficiently editing the DOM and creating visualizations based on data. If all you want is to quickly insert a generic bar graph into your app, then D3 is probably not for you, but if...... читать далее
react d3js datavisualization tutorialРазработка • Scott Hanselman's blog • 11 мая 2021 г. 18:17
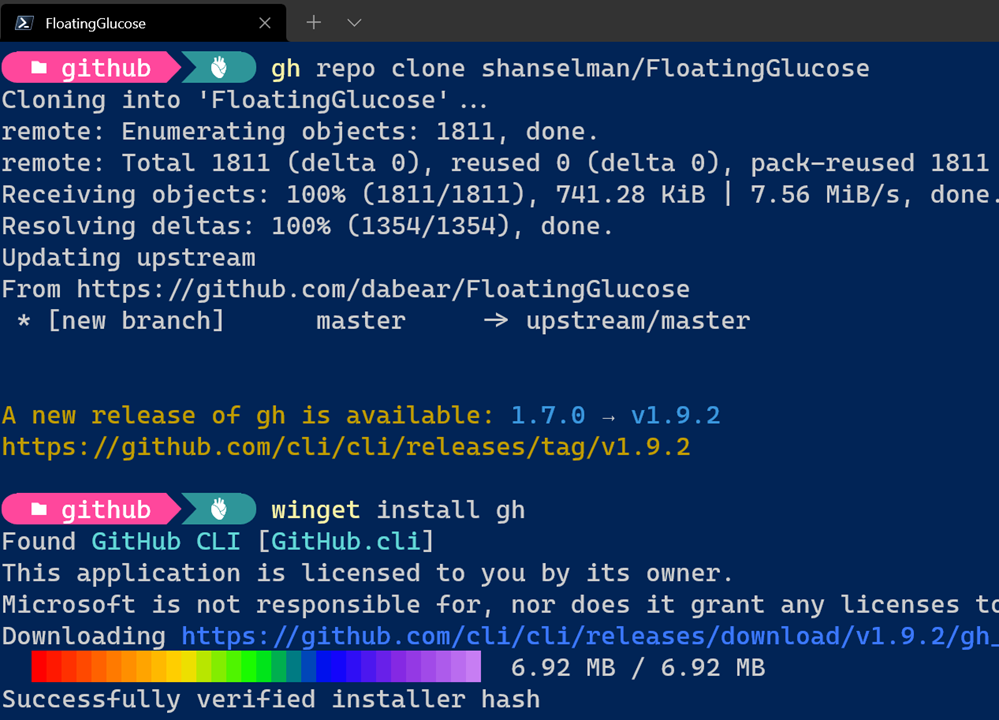
Last month I learned how to convert a 13 year old .NET app to modern .NET 5 with the "try convert" tool. It was surprisingly easy to bring a "legacy" app well forward to a pretty darn cool self-contained app. That means NO .NET install. Just run an e...... читать далее
Diabetes DotNetCore Open SourceРазработка • DZone Web Dev • 28 апреля 2020 г. 16:39
I've recently open-sourced a new Coronavirus (COVID-19) Dashboard, which shows the dynamics (the curvature of the graph) of Сoronavirus distribution per country. Reasoning The reason for creating a new dashboard was to complement the well-known JHU D...... читать далее
javascript data analysis react coronavirus datavisualization chart.js